2018-03-16
Nanoscale Relative Emission Efficiency Mapping Using Cathodoluminescence g(2) Imaging
Publication
Publication
Nano Lett. , Volume 18 - Issue 4 p. 2288- 2293
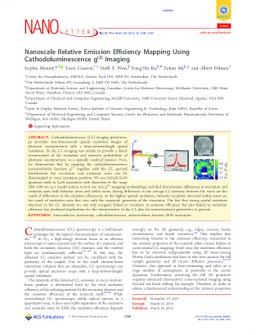
Cathodoluminescence (CL) imaging spectroscopy provides two-dimensional optical excitation images of photonic nanostructures with a deep-subwavelength spatial resolution. So far, CL imaging was unable to provide a direct measurement of the excitation and emission probabilities of photonic nanostructures in a spatially resolved manner. Here, we demonstrate that by mapping the cathodoluminescence autocorrelation function g(2) together with the CL spectral distribution the excitation and emission rates can be disentangled at every excitation position. We use InGaN/GaN quantum wells in GaN nanowires with diameters in the range 200–500 nm as a model system to test our new g(2) mapping methodology and find characteristic differences in excitation and emission rates both between wires and within wires. Strong differences in the average CL intensity between the wires are the result of differences in the emission efficiencies. At the highest spatial resolution, intensity variations observed within wires are the result of excitation rates that vary with the nanoscale geometry of the structures. The fact that strong spatial variations observed in the CL intensity are not only uniquely linked to variations in emission efficiency but also linked to excitation efficiency has profound implications for the interpretation of the CL data for nanostructured geometries in general. Keywords: autocorrelation function; cathodoluminescence; nano-optics; SEM; Semiconductor; spectroscopy
| Additional Metadata | |
|---|---|
| Netherlands Organisation for Scientific Research (NWO) , European Research Council (ERC) | |
| ACS | |
| doi.org/10.1021/acs.nanolett.7b04891 | |
| Nano Lett. | |
| Organisation | Photonic Materials |
|
Meuret, S., Coenen, T., Woo, S., Ra, Y.-H., Mi, Z., & Polman, A. (2018). Nanoscale Relative Emission Efficiency Mapping Using Cathodoluminescence g(2) Imaging. Nano Lett., 18(4), 2288–2293. doi:10.1021/acs.nanolett.7b04891 |
|